On Thursday, Amazon issued a press release talking up the sales of new Kindles. The most interesting part of this is that for the first time they publicly put a number on the sales volume of the kindle. Specifically they said:
Amazon.com today announced that Kindle devices remain the hottest products this holiday season – for the third week in a row, customers are purchasing well over 1 million Kindle devices per week…
The real crux of that is the 1 million kindles per week. True to form, Amazon wasn’t specific about how that 1 million devices breaks down, i.e. how many of those sales are the Kindle Fire, Kindle 4 and Kindle Touch. Reverse engineering this number would be interesting for comparison between the Kindle Fire and its competitors.
A first approximation of this was offered by Marco Arment and Shawn Blanc. They tried to use their affiliate tracking codes to generate a proxy for relative sales. This method, however, proved flawed since in both cases they had made strong recommendations for/against the various kindles which skewed their numbers. We can be sure of this because their results were so wildly different.
I thought of two other proxies for sales that might help us get closer to a real number.
- I looked at the number of customer reviews made for each of the various Kindles since December 1. Assuming that customers of each product are equally likely to write a review this should give a reasonable estimation for relative sales volumes.
- I did a search on TwitPic for “New Kindle” and went through the recent pictures tallying up the relative counts of the various models. My assumption here is that people would share pictures of their new devices with roughly equal measure. Since the devices are physically so different, it was easy to distinguish their purchases.
The results are as follows:
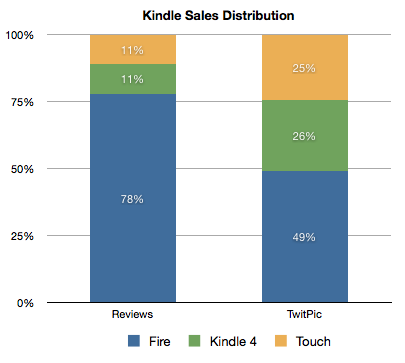
From the differences between these two charts we can see that neither method is perfect. However, they do both paint a fairly consistent picture of rough sales. The Kindle Fire appears to be selling best, and by a fairly large margin. The Kindle 4 and Kindle Touch are selling at a slower rate than the Fire but a roughly equal rate to each other.
As a developer I’m interested in this because I want to know how many Kindle Fires are being sold, and thus how large of a potential market for my apps the Amazon Appstore presents. Before the launch of the Fire this market was insignificant (as I’ve shown before). If we take the most favorable of these two estimates it would mean Amazon is selling 780,000 Kindle Fire each week. For comparison, Apple reported selling iPads at a rate of around 926,000/week in the quarter ending September 24. Assuming the sales bump the iPad got last Christmas, where sales were 75% higher than the preceding quarter, Apple may be selling as many as 1,600,000/week right now.
The Kindle Fire is clearly the best selling Android tablet to date but is still significantly lagging behind the iPad, even with its dramatically lower price.